Contents
- Index
Generating a Trait-Association by Environment biplot
The trait-assocaition biplot is also referred to as a covariate-effect biplot. This module requires a combined genotype-by-(trait+environment) two-way table or a genotype-by-environment-by-trait three-way dataset, from which such a combined table can be automatically constrcuted using GGEbiplot.
Steps of generating a Covariate-Effect biplot
This analysis involves the following steps, which are automated in GGEbiplot, known as the covariate-effect biplot module under the main menu of VBV Biplot (also referred to as Canonical Biplot sometimes although there are some differences).
- Under the main menu VBV biplot, click Covariate-effect biplot based on..., and select r-matrix.
- In the older version of GGEbiplot, the data have to be arranged such that the columns of explanatory variables are followed by response variables (as the above example) and the user has to know the number of explanatory variables in the data. When the function is invoked, the user will first be asked for the number of explanatory variables in the table so that GGEbiplot knows how to divide the variables into explanatory variables and response variables. The number of explanatory traits in our data is 21. (Under the cover, GGEbiplot will calculate a 21 * 25 trait by environment table of correlations coefficients. Since the correlation coefficients represent the effects of each trait on yield, this table is referred to as a covariate-effect table.)
- In the newer version of GGEbiplot, the data format is more flexible. When the function is invoked, a form like this will appear and the user is asked to separate the variables into N explanatory variables and the M response variables.
- The researcher is then asked to provide a probability threshold, which will be used to remove traits that are not significantly associated with the target trait in all the environments. Here we give the value 0.01.
- Traits that did not associate with the target trait at the probability level in at least one of the environments will be removed from the covariate-effect table. The user will be noticed about the number of traits that are removed:

- The user will then be asked if he wants to permutate an experiment-wise Type I error threshold for further deletion of explanatory traits:

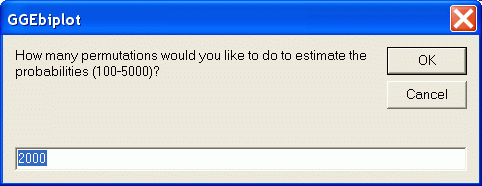
- If Yes is selected, then the user will be asked how many permutations to conduct:

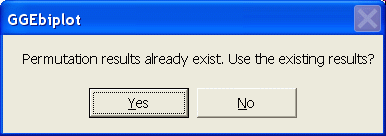
- If the user has done permutations for the same dataset and the same setting, which should have been stored in the hard disc, he will be asked if he wants to use the existing results or do it over again:

- When the permutation is complete, the user will be asked for a probability level, which will be put in the biplot as threshold circles. Here we supply 0.01.
- When the calculation is complete, a Covariate-effect by environment biplot will finally show up, together with the threshold circles.
Continue to read: Interpreting the Covariate-Effect by Environment biplot
In Depth: How permutation is conducted


