Contents
- Index
Interpreting the trait-effect by environment biplot
Previous topic: generating a covariate-effect by environment biplot.

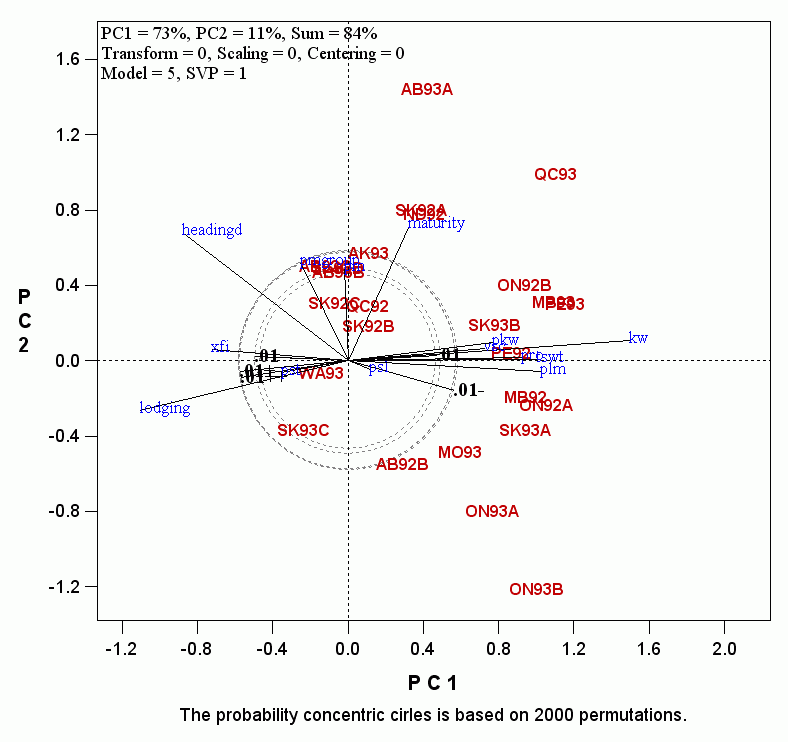
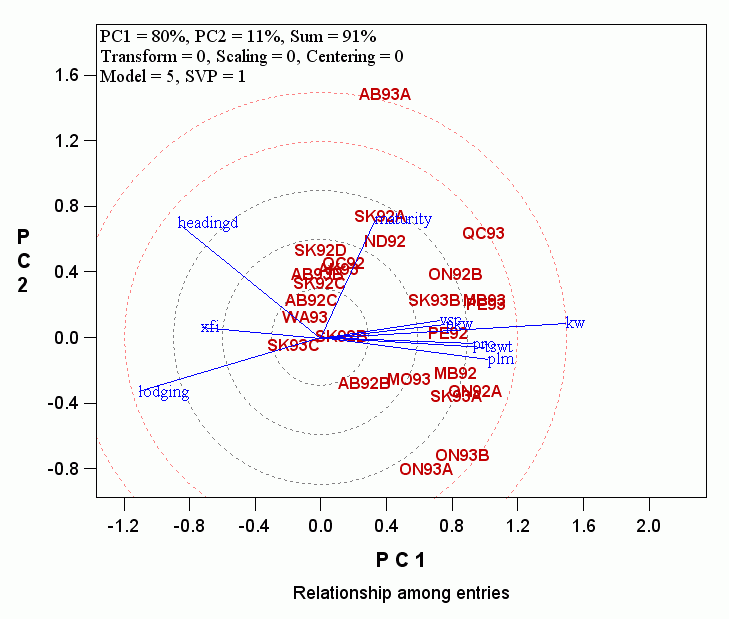
- Note that there are 5 circles labeled as 0.01, 0.01+, 0.01++, 0.01-, and 0.01-- . Multiple circles are presented because the biplot does not explain 100% of the total variation. Therefore, the threshold is a range rather than a precise level. The length of the vector of a trait, or of a simulated observation, is determined by the magnitude of the trait's effect on the target trait. However, it is also affected by two factors: 1) the similarity of the trait with other traits, and 2) the consistency of the trait's effect across environments. More specifically, if a trait is similar to many other traits, its vector tend to be longer, because the similarity forms a strong pattern, which is likely to be captured by one of the first few PC's. For the same reason, if the effect of a trait is relatively consistent across environments, which also represents a strong pattern, it is more likely to be captured by one of the first few PC's. Therefore, the threshold circle with the shortest vector is more appropriate to select any traits that have a strong effect in any environment, whereas the threshold circle with the longest vector is more appropriate for selecting traits with strong effects in most environments. It is up to the user to decide which circle is used to remove "unimportant" explanatory traits. The difference caused due to these factors in our example is whether the traits PM and PMGROUP (both are powdery mildew scores) are excluded or included. Here we remove all the traits that fall within the circles, and the biplot becomes:

(BUT NOTE: The new version shows only one circle to simplify interpretation)
- The length of the vector of a trait measures the importance of the trait in explaining the GGE (genotype main effect plus genotype by environment interaction) of the target trait. The concentric circles help visualize this. Thus, the importance of the traits in determining barley yield in this dataset are:
Kernel Weight > Lodging >= Days to Heading > Test weight = Plumpness > Days to Maturity =Plump kernel weight = protein content > XFI.
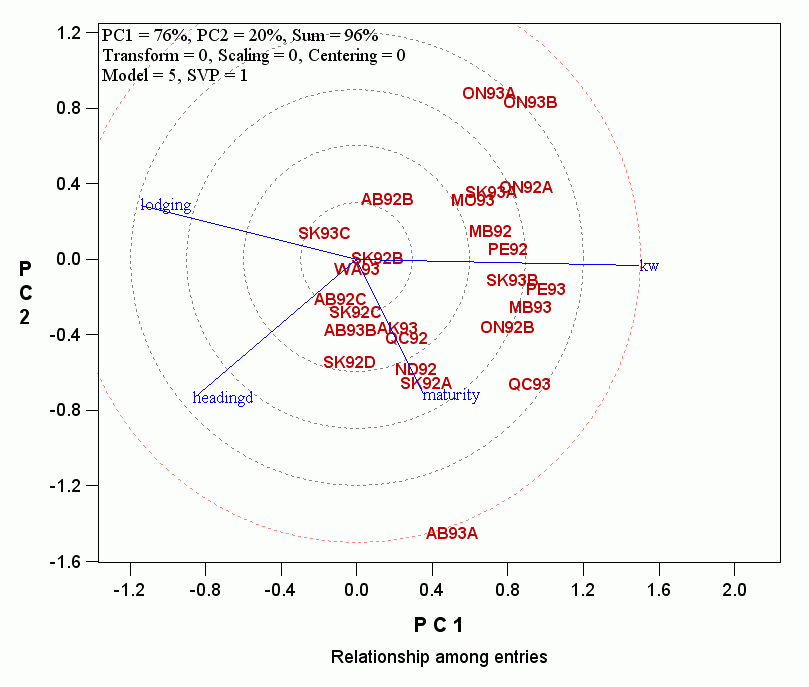
- The angles between traits measure the similarity of the traits in their effects on the target traits. Thus, kernel weight was similar to a cluster of traits including plumpness and test weight, but was very different from lodging and days to heading.
- To simplify the discussion that will follow, the traits with relatively short vectors can be further removed so the covariate-effect biplot looks like:

Continue to read: Mega-environment classification


